Surjit S Bhalla
February 7, 2015
 The Indian statistical authorities (Central Statistical Organisation or CSO) recently released a revised set of GDP numbers that have set the statistical house on fire. The new salvoes being fired from the CSO’s shoulders suggest a radically different interpretation of the Indian growth story over the last few years, and indirectly, of what happened in the national elections in May 2014. Just to recall: in May 2014, the ruling Congress party was decimated and registered its lowest seat tally ever, 44 seats in a 543-seat Parliament. For those keeping records, this was the second largest decline in parliamentary history in the world, possibly ever. The record holder for the worst thrashing was the Progressive Conservatives Party of Canada. Under Brian Mulroney, the Progressive Conservatives won re-election in 1988, with 169 out of 295 seats. At the subsequent election, in 1993, the party collapsed to win just two seats, falling from first to fifth place.
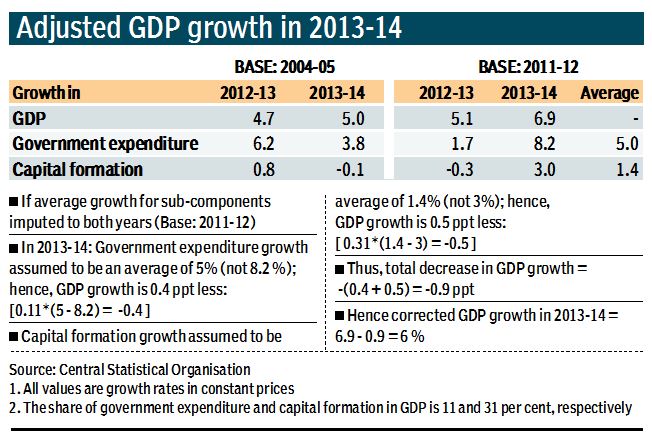 Many of us thought that a major reason for the magnificent loss of the Congress was the economy. We were told that GDP growth for two successive years was less than or equal to the 5 per cent mark, 4.7 per cent in 2012-13 and 5 per cent in 2013-14, a toxic decline from the heady years of near-double-digit growth. If GDP growth declines by half, voters are likely to be upset, and we all concluded that the voting reflected the pocketbook. Much ink was spilled, and many trees were cut, to document the close relationship between economic performance and voting behaviour.
Now, with the sensational results reported by the CSO, on the basis of revised and improved GDP, more trees are going to be felled. What the CSO now says is that GDP growth in India was 5.1 per cent in 2012-13 and a miracle tiger growth rate of 6.9 per cent in 2013-14. Again, to recall and reiterate, just yesterday, all of us thought that 2013-14 was the near-worst GDP year in recent memory, and only marginally better than the retrospective tax year of 2012-13. As some people are now saying, “Wow, Sirji, what a recovery!” — from paralysis to a surge in activity and faster than a BMW reaches 80 mph.
What the data do suggest is a mirrors and smoke interpretation of CSO statistics. Before documenting, some caveats and disclaimers, in defence of any revised numbers put out by the CSO or anyone else. Data and methodological revisions are undertaken by all countries, and developing countries like India do undertake these revisions on a larger and more frequent scale.
New data for manufacturing, change in the base year from 2004-05 to 2011-12, segregation of crop and livestock production, estimation of value addition from the extraction of sand through an indirect method in accordance with its use in construction, the inclusion of accounts of stock brokers, etc, the movement to market prices from factor cost, etc. All these changes are necessary, and welcome. So, why question the surge in GDP growth in 2013-14?
Because the CSO revisions do not pass a basic smell test. When data are revised, they are revised for all the years under consideration, in this case 2012-13 and 2013-14. New information, base year changes, etc should affect the data for both the revised years and affect them approximately equally. Different economic conditions in different years will result in differences; however, these differences should be minor. And if not, smell tests require that a more than adequate explanation be provided. And this has not been provided by the CSO.
Let us go down the list. In the two years, GDP growth was 9.7 per cent in the old data, and 12 per cent in the new data. That is a difference of 2.3 percentage points; thus, for each year, GDP growth estimate should be raised by 1.15 percentage points. This is the gross effect of the new information, different base year, etc. If the new GDP growth rates were 5.9 per cent and 6.2 per cent (instead of 4.7 and 5 per cent), this would have been a dog-bites-man story and would not have gathered any newsprint, or dust. Instead, the gap in the two years is reported as 1.8 percentage points (5.1 per cent vs 6.9 per cent). Now, that is a small dog biting a big man story.
Some of the explanations offered to explain this gap (nobody is questioning the revisions) is that there was a surge in productivity in 2013-14, or new industries began to flourish in 2013-14, etc. Really? In a policy paralysis year, with bank balance sheets broken, and ease of doing business worse, there was a surge in investment activity? Old data: capital formation growth declined from (+)0.8 per cent to (-)0.1 per cent; new data, capital formation growth BMW accelerated from (-)0.3 per cent to, hold your breath, (+)3 per cent. Smell test — Fail.
The bigger egregious “error” is with regard to government consumption expenditures. These expenditures are for teachers, hospitals, government workers’ salaries, etc. When then finance minister P. Chidambaram went on an expenditure cutting spree in 2013-14, it was precisely these expenditures that he was reducing. There is no new information, or new survey, etc with regard to government expenditures; if some local body expenditures now enter the system, they should enter in both the years. So what explains this wide discrepancy between reliable reality and unreliable statistics? Actually, all the explanations suggest that government consumption in 2013-14 grew at a lower rate than in 2012-13; instead, the new CSO data suggest that real government expenditures accelerated from only a 1.7 per cent growth in 2012-13 to a 8.2 per cent growth rate in 2013-14. According to reality check old CSO data, real government consumption expenditures decelerated from 6.2 per cent growth in 2012-13 to 3.8 per cent growth in 2013-14. Smell test — Big Fail.
How much difference do the corrections for investment and government spending make? About 1 per cent less growth in 2013-14 than the 6.9 per cent growth stated by the CSO, with 0.4 per cent less contributed by real real government spending and 0.5 per cent less contributed by real real investment spending [see table].
Delhi election tailpiece: As you read this article, you will be going out to vote. The Delhi assembly election has seen much excitement, and our “poll of poll” calculations suggest that the excitement is yet to begin. The median vote share, according to eight polls undertaken in February 2015, suggest the following vote shares for each of the parties — AAP: 43 per cent; BJP: 37 per cent and INC: 13 per cent. The corresponding seats — AAP: 43; BJP: 25 and INC: 2. It may be the case that the opinion polls are wrong, but a large selection of such polls being wrong is unlikely.
The writer is chairman of Oxus Investments, an emerging market advisory firm, and a senior advisor to Zyfin, a leading financial
information company.
No comments:
Post a Comment