ANNETTE M. KIM
 Mapping a city’s buildings might seem like a simple task, one that could be easily automated by training a computer to read satellite photos. Because buildings are physically obvious facts out in the open that do not move around, they can be recorded by the satellites circling our planet. Computers can then “read” these satellite photographs, which are pixelated images like everyday photographs except that they carry more information about the light waves being reflected from various surfaces. That information can help determine the kind of building material and even plant species that appears in an image. Other patterns match up with predictable objects, like the straight lines of roads or the bends of rivers.
Technology is transforming city life, for better and worse.
It turns out to be more complicated than that. When three different research groups (including my own at the University of Southern California) processed almost the same images of Ho Chi Minh City’s rapid urbanization during the 2000s, we produced different results. All three groups agreed on the location of the city center, but mine mapped the city’s periphery differently. That’s the place where most megacities in the global South exhibit their most dramatic physical growth. In particular, we identified more of the informal, self-built housing in the swampier southern area of the city.
That matters because government planners use maps to analyze the city. They identify where the population lives, and they shape plans for public services and investment based on that information. If settlements are not mapped, they don’t exist in the eyes of the state. Worse, the people who live in the low-quality, self-built housing I detected at the periphery tend to be more marginalized already: often lower-income residents and migrants to the city. They are also more often located in geologically vulnerable areas that are at risk of natural disasters such as flooding and mudslides. Satellite images are useful for urban planning, but relying on the information they provide without verifying conditions on the ground can cheat the world’s most vulnerable populations.
The interface between technology and unequal social structures is finally getting some much-needed attention. When smart-city institutions rely on computer algorithms to expedite their work, they can embed unintended bias into municipal operations, resulting in things like racially biased criminal sentencing, information searching, and financial access.
One of the reasons for this embedded bias is that human beings are the ones creating the code and they write it based on the assumptions in their own knowledge frameworks and experience about how the world operates and is organized. As designers learn about unjust and mistaken outcomes, one strategyfor overcoming these blinders is to have a workforce with more diverse experiences and worldviews writing the code. Another is to have a more transparent and democratic process for correcting and improving them.
Algorithmic justice in urban planning has received less popular attention than criminal justice or surveillance. But the stakes are high for land use and city infrastructure, too. For the first time in human history, the majority of human beings live in cities. This historic shift has occurred because of rapid urbanization in the Global South, which has primarily been driven by the influx of rural migrants. Despite coming to cities with fewer resources, these new urbanites have helped fuel the urban economy by providing a large body of low-cost labor. At the same time, anti-immigrant sentiment has caused growing contestation of their right to be in the city, pushing newcomers to eke out livelihoods in precarious situations.
In Ho Chi Minh City, one-third of all jobs are in the informal sector. Traditional methods of counting such people—census questionnaires and field surveys, for example—are costly to administer and quickly outdated, since they are usually collected every 10 years. Furthermore those methods usually do not include the new urbanization that may occur just outside official urban boundaries. It’s difficult to count the new population of urban immigrants and their informal livelihoods when they are living outside regulatory bureaucracies and their documentation processes. The location and patterns of their settlements are often unplanned. As a result, some of the poorest residents are often living in precarious places without public sewer, drainage, solid-waste, and other infrastructure systems.
New technologies like satellite imagery offer a promising remedy to this blind spot. The resolutions of satellite images vary, but in general they have increased over the years. In the 1990s, a single pixel of a typical image might have represented about 30 square meters of land area. By 2000, 10 or fewer meters a pixel was commonplace, and now 0.5 meters (1.5 feet) of resolution is possible. Today’s images also contain more data, making it possible to discern building heights, plant species, and other environmental details. Most importantly, the satellites are constantly circling the Earth, gathering consistent, reliable, and low-cost data. Collecting information remotely from machines can allow for wider coverage of urban regions, and consistent collection allows for better benchmarking and detection of changes. We can see changes in the larger urban region better than ever.
For urbanists, the greatest bottleneck is how to process this data. While we are making advances in our ability to manipulate and interpret the data, our models risk becoming disconnected from the situation on the ground. Researchers primarily conduct this computational research sitting in an office, ultimately making assumptions about what they are seeing in the data.
One common assumption is that shiny, dry things are urban. That is, urban spaces are those that use construction materials that are not found in rural areas, such as concrete. From the satellite view, urban spaces are also assumed to exhibit geometric spatial patterns, such as straight roads and contiguous, rectilinear buildings. These assumptions might hold for planned, formal urban development, as in the center of a city. But informal urban structures might use less shiny, wetter materials, such as plant materials. These self-built buildings might also might not line up in a straight row, spaced at regular intervals.
To overcome these issues, my research group trained our maps on a computational model derived from on-the-ground fieldwork, commonly known as ground-truthing. I tromped out into the swampy south side of Saigon confirming that, yep, this blurry blip in the picture is definitely a house. We adapted an algorithm to reflect this reality, by allowing things that were slightly less shiny to be classified as urban if the texture of the area was too variegated to be rural vegetation. Our results recovered 12 percent more newly urbanized land area defined by the parameters determined through field survey than would have been discerned using conventional methods.
To find out why our results differed, we convened a panel with the other two research groups at a World Bank conference in 2017. We wanted to understand how our different results could impact urban management, and how technologies for urban research might adjust accordingly. We discovered that differences between the three groups’ studies emanated from the researchers’ particular interests in using satellite imagery. That is to say, the results they achieved were fundamentally shaped by the goals with which they began their urban data-analysis effort.
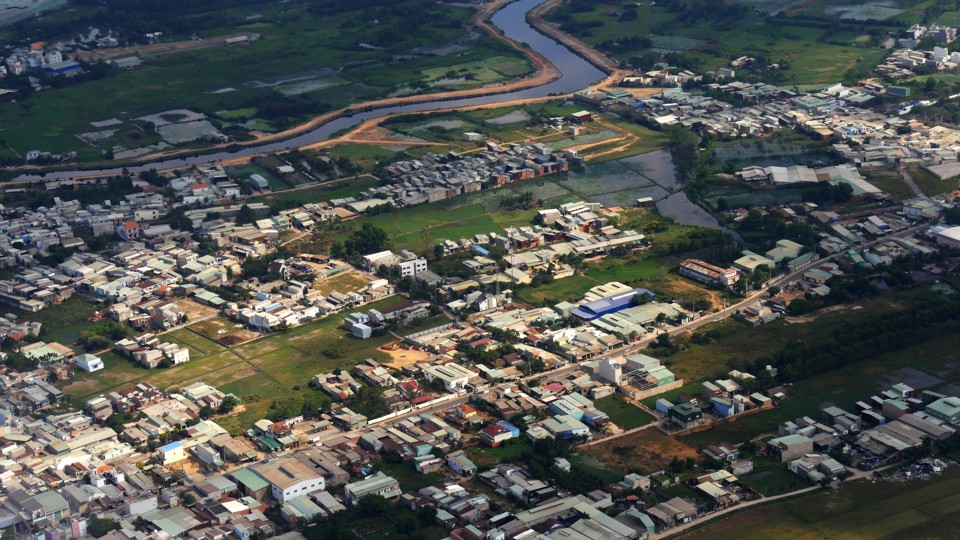
My research was framed by international development policy’s interest in improving substandard housing, with a focus on Vietnam in particular. The New York University group’s study was part of a larger project measuring urban expansion in over 100 cities around the world; they sought to establish standardized global urban indicators in order to offer a more comprehensive historical picture of regions of the world. Meanwhile, the World Bank commissioned the University of Wisconsin at Madison as a part of its East Asia urbanization data initiative. The Wisconsin team typically studies urban sprawl in order to assess how costly it would be to provide infrastructure. Mapping houses and buildings may seem like a straightforward task, but converting data into information depends on the objectives of the institution conducting—and funding—the project.![]() Different methods and goals produced different results for satellite-image-based urban mapping in Ho Chi Minh City. (USC Spatial Analysis Lab)
Different methods and goals produced different results for satellite-image-based urban mapping in Ho Chi Minh City. (USC Spatial Analysis Lab)
The image above shows a comparison of how our results varied on the urban periphery. All three agreed on the center of the city where it was unambiguously urban, colored in black. However, the purple areas show that only the Wisconsin researchers classified large northern sections of the city as urban, where it contains drier geology. Both the NYU group and the USC group classified more detailed areas, with my group particularly emphasizing the smaller developments in the wetter southern region, in yellow.
If a local city government used just one of these studies to make policy decisions, they might have focused on different areas of the city for public services and infrastructure development. If the government overlooks the areas where informal urbanization has emerged, particularly amid low-lying areas near rivers that are prone to flooding, these precarious communities are at greater risk without disaster and resilience planning—not to mention planning for future transportation and infrastructure development, climate-change flood adaptation, and resettlement needs.
Increasingly sophisticated, automated methods for providing land-use data to urban planners promise to relieve some of the information gap for local officials. But in truth, without care these computational methods might introduce even more persistent blind spots than the manual efforts that they are replacing. In response, local governments will still need to question the information they receive. Instead of consuming that data as truth, they should participate in its creation, bringing their local knowledge to bear on information from satellites in orbit and researchers across the world.
Of course, that requires more effort from local governments, which are often strapped for time and resources in the first place. They’ll need help. Protecting all the new urbanites, especially the most vulnerable ones, will require greater integration between technologists, community organizations, and anthropologists. In addition to high-resolution satellite images processed by complex data models, global cities also need information about field conditions—and that knowledge is best formed from local participation and ground-truthing. Alas, this means we cannot manage cities purely from our labs with remotely sensed images. But when you stop to think about it, it would be strange to assume otherwise.
No comments:
Post a Comment