ABHIJNAN REJ
As India’s relations with both China and Pakistan continue to deteriorate, the country’s policy-makers must contemplate the unpleasant possibility of a 'two-front' war with both countries.[1] Whether or not such a war would be overtly collusive between China and Pakistan – that is, whether they would pre-plan a joint attack on India or it would be a case of strategic opportunism – it is clear to many in positions of authority that the Indian military remains fundamentally unprepared for such a challenge.[2] But it can also be argued that a two-front force ratio (ratio of Pakistani and fraction of Chinese inventories to India’s) has evolved and varied considerably over time, as China continues to rapidly modernise and numerically increase its military (through significant increases in defence spending[3]) while Indian military preparedness flounders.
In this report, such an evolution and variation of a two-front force ratio is quantitatively examined using time-series data constructed from ten IISS Military Balance[4] volumes, from 2008 to 2017,[5] with the assumption that the data are accurate and consistent across years. The key finding of the report is that this force ratio – never in India's favour to begin with – is currently shifting in favour of the adversary both for the Indian Army as well as – more strikingly – for the Indian Air Force, even after considering smaller fractions of the Chinese military involved in a two-front conflict. The naval picture, when it comes to the time-series trends, is marginally better than that of the other two services, though the force ratios themselves remain problematic for India. The report also includes the overall nuclear balance between India, Pakistan, and China, for the sake of completeness (using Bulletin of Atomic Scientists data).
A caveat is in order. The report works with only 11 (conventional) equipment variables and a simple quantitative assessment. Therefore, a much more granular study is necessary for a firm establishment of the results. It is also quite likely that should India face a two-front threat, other powers will step in on its behalf; therefore, the effective forces available to India may be much higher than just Indian forces. Having said that, the results that do appear are disturbing enough and portend ill for India in the event of a collusive threat from Pakistan and China. It also points to an urgent need to make qualitative and quantitative improvements in the Indian military.
Background
A two-front war could start against India in three different ways. Firstly, Pakistan takes advantage of an India-China conflict. Secondly, China engages in strategic opportunism in an India-Pakistan conventional military engagement. Finally, China and Pakistan collude to launch a surprise-coordinated attack from both India’s east and west. Of these scenarios, the first is the most probable given that China would be hesitant to be seen as being either opportunistic or overtly aggressive at a time when Beijing is engaging in a hard sell of its global aspirations throughout Asia. This also seems the case because of the simple fact that if China was to take on India directly, it could very well do so without Pakistani assistance. The likely possibility is a border war between India and China which Pakistan exploits to open a front across Kashmir to compensate for its inferior force ratio vis-à-vis India.
To see this, consider Figures 1 and 2. Figure 1 plots the ratio of total Pakistani and Chinese main battle tanks (MBT) to India’s.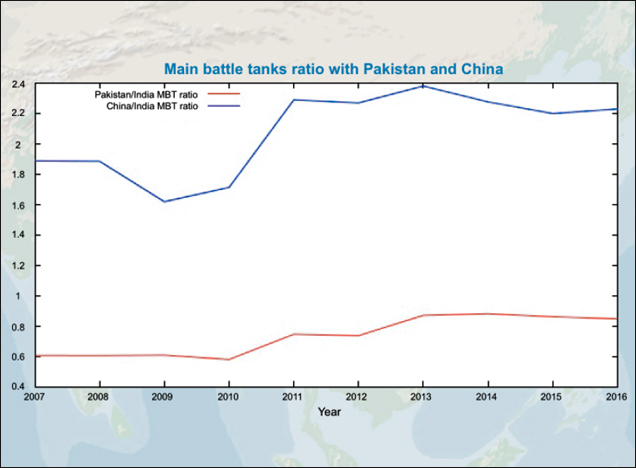 Figure 1
Figure 1
Figure 2 plots the ratio of the two countries’ total combat capable aircraft to India’s.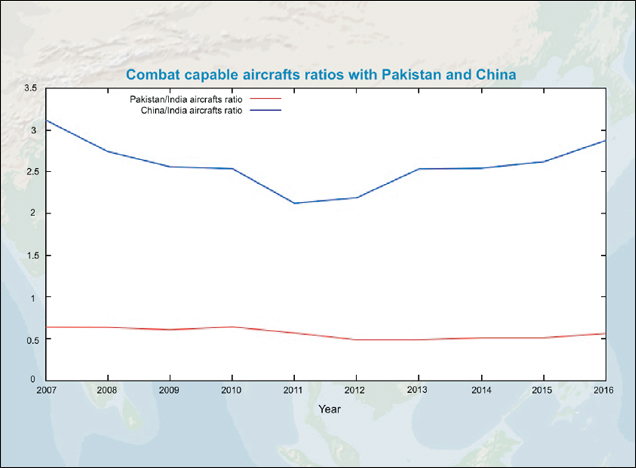 Figure 2
Figure 2
In terms of the ratio of Pakistani MBT to India’s, India has steadily lost its advantage. In 2007, this ratio stood at 0.61, which by 2016 had risen to 0.85. (The simplest way to read force ratio numbers is to see them as the adversary’s strength given one unit of Indian equipment. Therefore, increasing force ratios signify depleting Indian strength.) The same pattern reappears when it comes to China, where the MBT ratio has risen from 1.89 in 2007 to 2.23 in 2016. For the total number of combat capable aircraft, the situation is marginally better. In 2007, this ratio for Pakistan was 0.64, which ten years later decreased to 0.56. The total aircraft ratio between China and India has also decreased in the same period, from 3.12 to 2.87 (Figure 8 presents the total number of combat capable aircraft for each of the countries.) Nevertheless, the Chinese superiority in these two metrics is striking.
Figure 3 looks at a naval metric—the ratio of Pakistan/India and China/India frigates.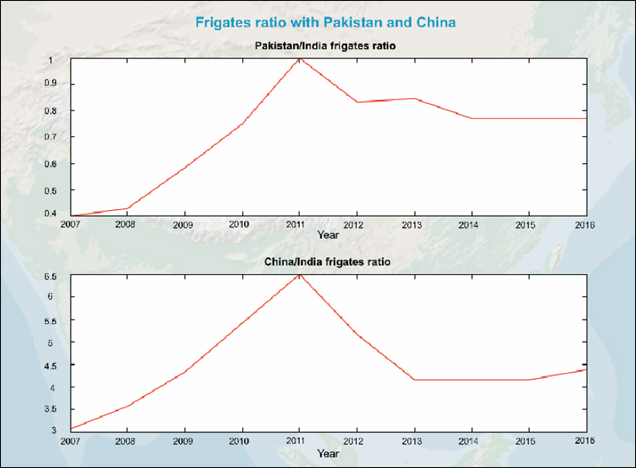 Figure 3
Figure 3
The Pakistan/India frigates ratio increased between 2007 and 2016 because while the strength of the Pakistani frigate fleet has remained constant in that period, the size of the Indian fleet has decreased by two vessels, from 16 frigates in 2007 to 14 in 2016. As expected, China enjoys a dominance over India in the size of its frigate fleet. In 2015, the ratio between the two fleets was 4.07. The ratio dropped the following year due to a decrease in the Chinese fleet by four ships. What is, however, quite striking is the overall decrease in the size of the Chinese fleet: from 68 ships in 2011 to 53 ships in 2016. This is most likely the result of Chinese naval modernisation that puts a premium on technological quality over quantity.[6]
It should also be noted that this analysis is not only a matter of bean-counting three variables. In a recent book, defence analysts Pravin Sawhney and Ghazala Wahab detail several ways in which the PLA enjoys a distinct advantage over India, such as leveraging integrated theatre commands as well as a unified rocket force that replaces antiquated artillery-based tactics.[7]Furthermore, American political scientist Walter Ladwig III’s research has detailed qualitative variables – such as geography and posture – that show that India’s much-vaunted strategic superiority over Pakistan is a hollow claim.[8]
Analysis of two-front force ratios
In order to model two-front force ratios (TFFR), the following formula has been used:
TFFR = (XPak + α×XChn)/XInd
Here XPak, XChn, and XInd denote total Pakistani, Chinese, and Indian equipment of a certain type X, respectively, which could vary. In other words, X could be MBT or fighter aircraft or some other equipment. The coefficient α is a number between 0 and 1 and specifies the fraction of Chinese equipment to be used by that country against India in a two-front war. In this article, α = 0.1, 0.2, 0.3, or 0.4, meaning that it considers cases where China uses 10 percent, 20 percent, 30 percent or 40 percent of its equipment of a certain type against India. (Following conventions on how force ratios are calculated, it is assumed that India and Pakistan will deploy all of its equipment of a certain type in a two-front conflict.)
The time series for the main battle tank TFFR is given in Figure 4.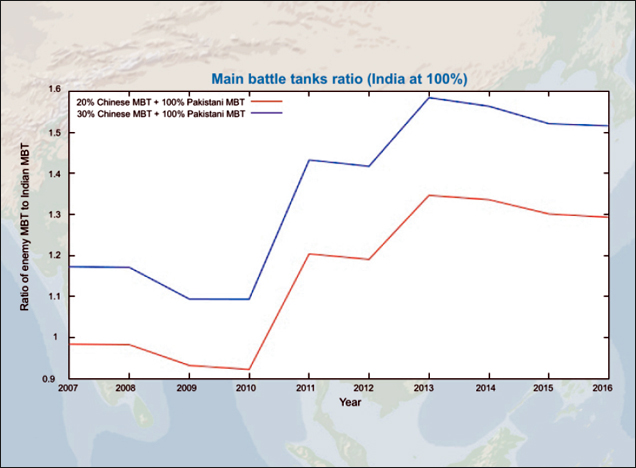 Figure 4
Figure 4
Two things stand out about this graph: one, how the TFFR has dramatically changed since 2010, and two, how Pakistan stands to gain vis-à-vis its MBT force ratio in event of an India-China conflict (compare Figure 1 with 4). To better understand the first point about Figure 4, it is instructive to look at the raw numbers behind it, as shown in Figure 5.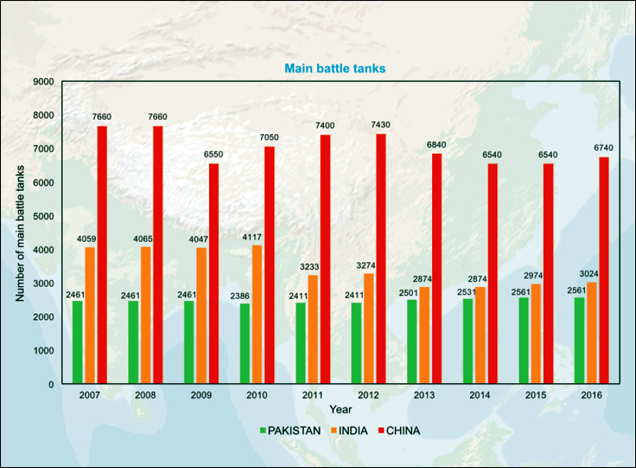 Figure 5
Figure 5
While Pakistan’s MBT strength has remained near-constant (with about a hundred MBT added over ten years), India’s MBT strength has significantly declined, by more than a thousand MBT. American scholar Shane Mason has recently argued this to be a reflection of Indian army’s “flatlined” capital budget, a result of the burden of creation of new mountain divisions to counter the Chinese threat.[9] In order to rectify this problem, the Indian government is currently proposing to replace the antiquated T-72 MBT with FRCV (future ready combat vehicles),[10] though this is still far from fruition. The decrease in the number of Chinese MBT can be explained by a general reorientation of the PLA under Xi Jinping[11] away from a being a ground-centric force and towards greater naval and air capabilities for the People’s Liberation Army Navy (PLAN), People’s Liberation Army Air Force (PLAAF), and the People’s Liberation Army Rocket Forces (PLARF).
It is the second point about Figure 4 that is more striking. Assume, as one of the plots in that figure does, that China deploys 30 percent of its MBT (α = 0.3, in the formula above) in a conflict with India. India’s overall MBT TFFR has depleted from 1.09 in 2010 to 1.52 in 2016 – a 39.4 percent decrease of the force ratio in this scenario. Therefore, Pakistan may indeed find it convenient to launch a limited attack in Kashmir in the event of an India-China war and forestall a counteroffensive by India along its western borders by leveraging the changed MBT ratio. This is in sharp distinction to the somewhat favourable Pakistan-India MBT ratio depicted in Figure 1 which would have prevented Pakistani adventurism to begin with, had China not been a factor. (Of course, this is not to claim that Pakistan’s decision to go to war would only be based on a calculation of TFFR in a way done here.)
The second TFFR is that of artillery strength, and the corresponding time series is depicted in Figure 6. Figure 6
Figure 6
Again, the same story as with the MBT is true here. Even at 20 percent Chinese deployment, the artillery TFFR increased from 0.69 in 2007 to 0.73 ten years later. What could be perceived as a silver lining – that this is the only TFFR that is less than one for India – is not really so. During this period, the Indian artillery declined to 1,618, but it is the dramatic reduction in Chinese artillery making the TFFR what it is. (Pakistan’s artillery strength has shown modest growth in this period: 4,291 in 2007 to 4,472 in 2016.) Between 2007 and 2016, PLA reduced its artillery pieces by 4,482. This reduction is reflected in recommissioning of the PLA Second Artillery Corps as the PLARF in December 2015.[12] It suggests a move away from artillery pieces and into short- and medium-range precision-strike missiles in order to have the same tactical effect. In India, some limited moves in this direction have been made with the deployment of Brahmos missiles to the border with China.
The TFFR for total number of combat capable aircraft are given in Figure 7. Figure 7
Figure 7
In order to unpack the TFFR, it is important to look at the raw numbers behind them (Figure 8).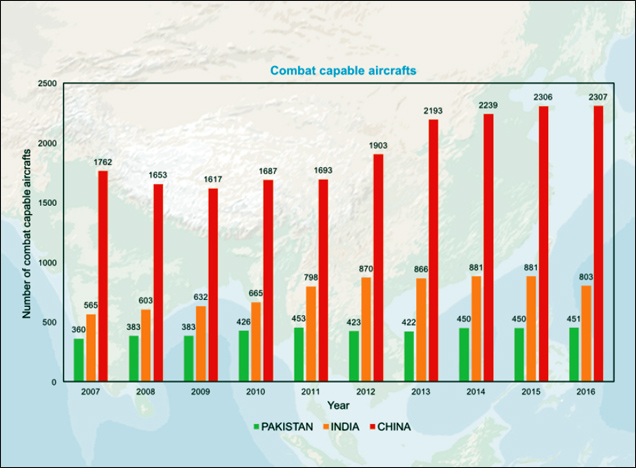 Figure 8
Figure 8
However, it is the serious depletion of the Indian Air Force’ strength – from 870 to 803 combat capable aircraft, between 2012 and 2016 – along with a more than 21 percent increase in the number of such PLAAF aircraft in that period that explains the plot. Just as in the case of the MBT TFFR, it is instructive to compare Figure 7 with Figure 2 in order to note the tremendous force multiplier the PLA is for the Pakistan military. In 2016, the Pakistan/India ratio went up from 0.56 to a TFFR of 1.14 in event of a two-front conflict, assuming a 20 percent Chinese involvement.
The variables considered so far may be – to some eyes – too coarse to tell a full story. In order to examine this claim, consider two finer variables: the total number of armoured combat vehicles that can transport an infantry squad (sum of armoured personnel carriers and infantry fighting vehicles), and the total number of fighter planes (including those with a ground attack role). To start with, consider the TFFR of armoured combat transport vehicles in Figure 9.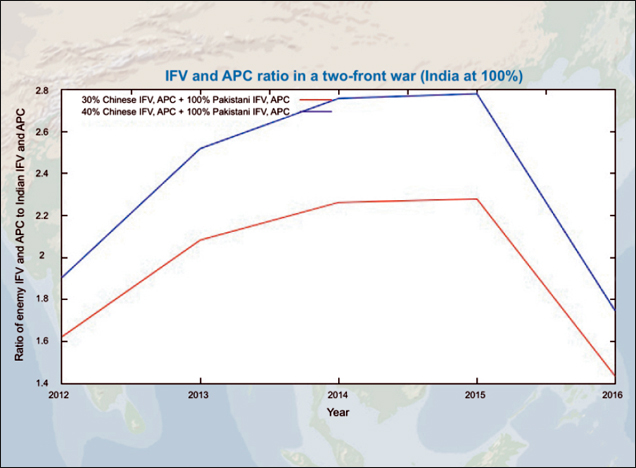 Figure 9
Figure 9
In 2012, at 30 percent Chinese involvement, the TFFR for IFV and APC stood at 1.62. This decreased to 1.43 in 2016. Part of the reason behind this welcome development is the rapid ongoing mechanisation of the Indian infantry[13] that has led to a massive induction of IFV between 2015 and 2016, from 1,455 to 2,500. (The Indian Army no longer uses the APC at its disposal; Pakistan, on the other hand, has only APCs.) The Chinese and Pakistani numbers of armoured combat transport vehicles remained relatively stable in this period.
The second finer-grained metric – of the number of fighter aircraft, possibly with ground attack roles – is examined in the time series of Figure 10.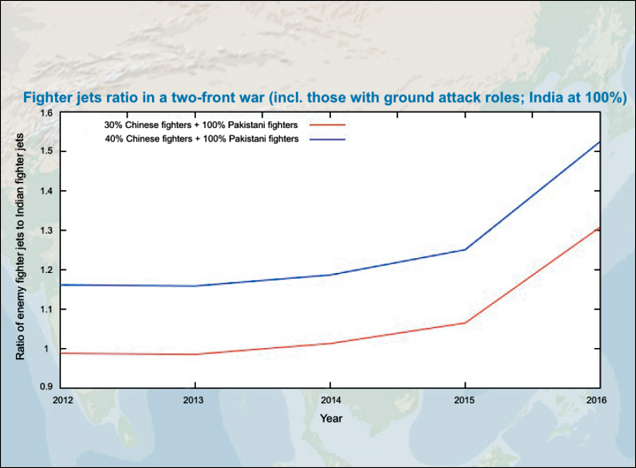 Figure 10
Figure 10
Figure 10 is perhaps the most depressing plot of the lot. In 2012, India’s FGA and FTR strength together stood at 799 aircraft. By 2016, this had depleted to 613 while the Chinese numbers in the same category remained stable. There is extensive commentary about the poor shape of the Indian air force, caught as it is in various bureaucratic turf wars and public controversy around acquisitions. Whatever be the reason, if the IAF continues to deplete at such rate, fighting a two-front war will soon become a theoretical impossibility. Air Marshal BS Dhanoa noted last year, “Our numbers are not adequate to fully execute an air campaign in a two-front scenario. The probability of a two-front scenario is an appreciation which you need to do. But, are the numbers adequate? No.”[14] The current analysis confirms his claim.
While the TFFR trends for many of the army and air force metrics considered here are quite problematic, the picture that emerges for similar force ratios for naval metrics is mixed. The TFFR trends for two principal surface combatants – destroyers and frigates – are slightly worrying. In case of the TFFR for frigates, it is unfavourable to India. However, the trends and TFFRs themselves for tactical submarines as well as naval combat-capable aircrafts present a better picture. All naval TFFR are calculated at three different levels, at α = 0.1, 0.2, and 0.3. This report is agnostic about what percentage of PLA-N will be deployed in the Indian Ocean in the event of a conflagration with India, though 30 percent of PLA-N deployed in the region should be the upper bound given that China will have to protect its ‘Near Seas’ from an opportunistic American or Japanese attack.
Figure 11 depicts the TFFR for destroyers.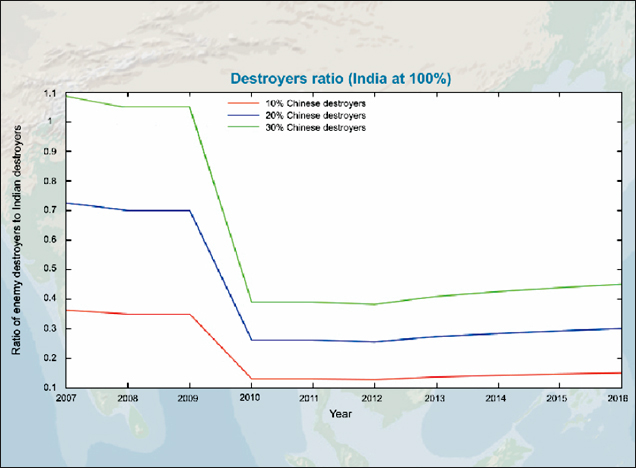 Figure 11
Figure 11
Taking the PLA-N destroyers deployed against India to be 20 percent of the total inventory, the destroyers TFFR increased from 0.26 in 2012 to 0.3 in 2016 (Pakistan has no destroyers, so the TFFR here is actually a China/India destroyers ratio at various values of α.) However, the most notable fact about this figure is the drop in the TFFR between 2009 and 2010. This is due to a drop in the PLA-N inventory. IISS data suggests that this was due to the decommissioning of Luda-class (Type 051) vessels. The Type 051 are China’s first generation of indigenously designed and built missile destroyers.[15] A 2015 US Office of Naval Intelligence Report corroborates this: “In recent years, shipboard air defense is arguably the most notable area of improvement on PLA(N) surface ships. China has retired several legacy destroyers and frigates that had at most a point air defense capability, with a range of just several miles.”[16] However, between 2011 and 2016, India and China added four and seven destroyers to their inventories, respectively.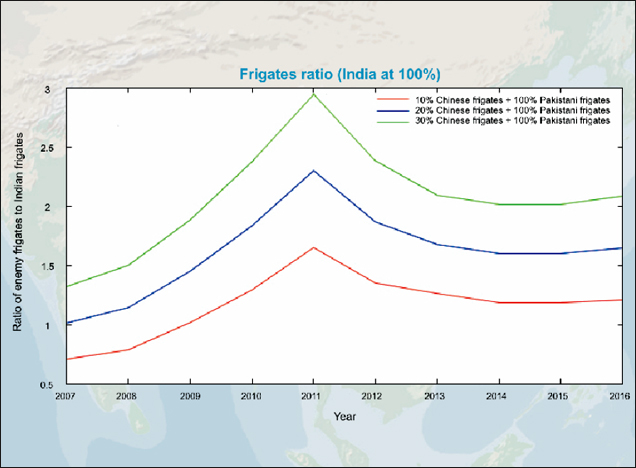 Figure 12
Figure 12
Figure 12 depicts the TFFR for frigates. This is where a particularly problematic picture emerges. In 2016, the ratio stood at 1.65 (assuming 20 percent Chinese deployment). According to the IISS data, between 2007 and 2011, India decommissioned five frigates, while Pakistan added four to its inventory. China’s inventory grew by nine frigates in the same period. All of this contributed to the alarming TFFR of 2.3 (assuming 20 percent Chinese deployment). It is only with a large number of PLA-N frigates decommissioning between 2012 and 2013 that the ratio shifted direction, along with a modest increase in the Indian inventory.
However, the quality of the newer generation of PLA-N principal surface combatants added to the inventory make up for the numerical decrease in stock. The 2015 ONI report notes: “[T]he addition of these new units allows the PLA(N) surface force to operate with increased confidence outside of shore-based air defense systems, as one or two ships are equipped to provide air defense for the entire task group.”[17] This indicates a greater expeditionary role for the newer generation of PLA-N destroyers and frigates and, as such, is bad news for India, as China thrusts into the Indian Ocean region.
The TFFR trend for tactical submarines and naval combat capable aircrafts are given in Figure 13 and Figure 14, respectively.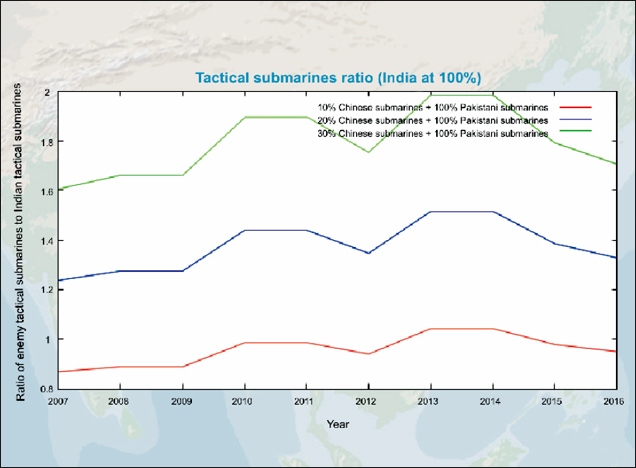 Figure 13
Figure 13
The TFFR for tactical submarines went up from 1.24 in 2007 to 1.33 in 2016, with a peak of 1.44 in 2010 and 2011 (assuming 20 percent Chinese deployment). Assuming 30 percent Chinese deployment, the TFFR in 2016 stood at an alarming 1.71. However, both India and China’s total number of tactical submarines have fallen: India’s fell from 16 in 2007 to 14 in 2016, while China’s fell from 59 to 53. The latter is, again, a reflection of China decommissioning older equipment in favour of more and more lethal submarines, including Type 093 (Shang-class) nuclear-powered attack submarines (SSNs). Further growth in the Type 093 SSNs in the PLA-N force structure would significantly increase China’s reach, “perhaps ultimately serving as the cornerstone of a genuine blue-water navy.”[18]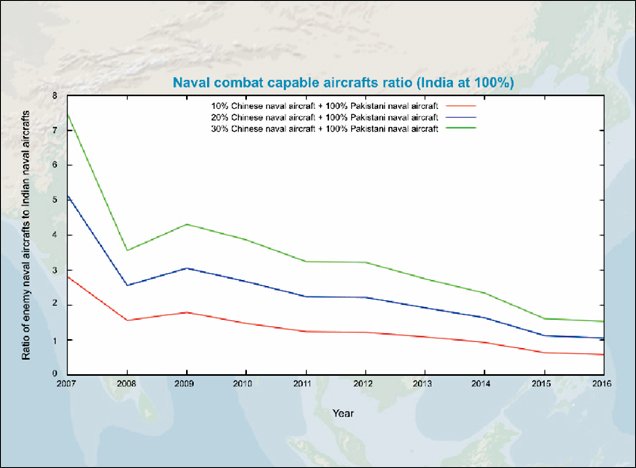 Figure 14
Figure 14
The TFFR for all combat-capable naval aircraft stood at a little more than one in 2016 (assuming 20 percent Chinese deployment). However, this is one metric whose trend is assuring for India. Between 2014 and 2016, India added 26 combat-capable naval aircraft to its inventory. This is perhaps due to the commissioning of the aircraft carrier INS Vikramaditya(Russian: Admiral Gorkshkov) to service in 2013 and in preparation to induct another aircraft carrier – INS Vikrant – to service in 2018. The dramatic drop in the number of Chinese combat capable naval aircrafts, between 2007 and 2008, was almost certainly due to decommissioning of a large number of obsolete Q-5 Fantan light attack aircraft (Chinese: Nanchang) and H-5 Beagle (Russian: Il-28) bombers.[19]
For the sake of completeness of the analysis in this report, Figure 15 depicts the nuclear balance between India, Pakistan, and China.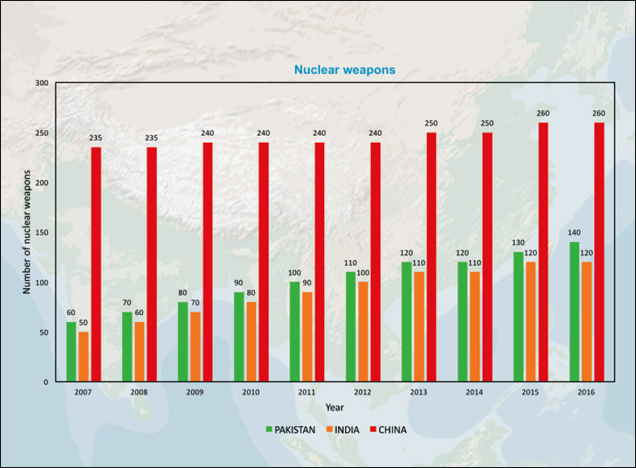 Figure 15[20]
Figure 15[20]
Conclusion
Notwithstanding the drawbacks that come with a bean-count, the analysis presented in this report disabuses the claim that the Indian military is ready to fight a two-front war, chest-thumping from some politically-motivated actors aside. It has become a trite observation by now that India, with its threat environment of two potentially collusive nuclear revisionists, ought to be spending more than 1.62 percent of its GDP[21] on the military. If military spending continues to be what the trend has been in the past few years, the Indian government may have to contemplate dramatic measures to bolster national security in the face of a two-front threat.
One such measure could be the introduction of cheaper yet potent alternatives such as tactical nuclear weapons into the conventional deterrence mix (a subject whose detailed discussion is beyond the scope of the current report). Purely looking at defence-economics aspects, this is desirable in terms of cost effectiveness (low marginal cost of production). However, this is not to say that such a step would be without significant political and military-planning costs. On the political end, for TNWs to be effective, command-and-control would have to be devolved to corps commanders, and the no-first-use posture would have to be abrogated. On the military planning end, conventional and nuclear war fighting capabilities have to be integrated in the joint doctrine of the Indian armed forces, and the military has to be trained and equipped to operate in a post-yield event environment.
Whatever be the remedial measures to be taken in the future, what is more worrying is India’s loud proclamations about having arrived as a global power when – as it became clear through the preceding analysis – it has hardly been matched by increases in its hard-power. Deng Xiaoping once exhorted his nation: “Hide your strength, bide your time.” India’s strength continues to be hollow while biding time has become an exercise in futility.
The author warmly thanks Kanak Gokarn, a researcher at ORF, for her help in preparing the graphics for the report.
[1] Shaurya Karanbir Gurung, “India must be prepared for two-front war: Army chief General Bipin Rawat,” Economic Times, September 6, 2017.
[2] Man Aman Singh Chhina, “Two-front war not a good idea, says top general,” Indian Express, March 1, 2018.
[3] Brad Lendon, “China boosts military spending 8% amidst ambitious modernization drive,” CNN, March 6, 2018.
[4] “The Military Balance,” International Institute for Strategic Studies, accessed March 16, 2018.
[5] A convention: given that the volumes publish data from the year before, the data reported below will correspond to the volume from the following year. For example, data quoted here for, say, 2010 would be from the 2011 volume, and so on.
[6] For a review of the latest developments in Chinese naval modernization efforts, see: Ronald O'Rourke,“China Naval Modernization: Implications for U.S. Navy Capabilities—Background andIssues for Congress,” Congressional Research Service, December 23, 2017.
[7] Pravin Sawhney and Ghazala Wahab, Dragon on Our Doorstep: Managing China Through Military Power (New Delhi: Aleph, 2017), 114-129.
[8] Walter C. Ladwig III, “Indian Military Modernization and Conventional Deterrence in South Asia,” Journal of Strategic Studies 38, No. 5 (2015): 729-772.
[9] Shane Mason, Military Budgets in India and Pakistan: Trajectories, Priorities, Risks(Washington DC: Stimson Center): 19.
[10] “Futuristic combat vehicle plan a game changer: Army,” Hindu, November 15, 2017.
[11] Roy Kamphausen and David Lai (editors), The Chinese People’s Liberation Army in 2025(Carlisle Barracks, PA: US Army War College: 2015).
[12] Anthony H. Cordesman (with the assistance of Joseph Kendall), The PLA Rocket Force: Evolving Beyond the Second Artillery Corps (SAC) and Nuclear Dimension (Washington, DC: Center for Strategic and International Studies, 2016): 3.
[13] Vijay Mohan, “4 new mechanised battalions for Army,” Tribune, January 11, 2017.
[14] Sushant Singh, “New report on IAF: it can’t protect north-eastern and western frontiers simultaneously,” Indian Express, March 28, 2016.
[15] Jiang Jie,“Farewell to Nanchang: first-generation Chinese guided missile destroyer decommissioned,” People’s Daily, September 9, 2016.
[16] “The PLA Navy: New Capabilities and Missions for the 21st Century,” United States Navy Office of Naval Intelligence, 2015, accessed March 21, 2018.
[17] Ibid.
[18] Andrew S. Erickson and Lyle S. Goldstein, “China’s Future Nuclear Submarine Force: Insights from Chinese Writings,” Naval War College Review (2007): 54-79.
[19] “The PLA Navy.”
[20] Data compiled from: Hans M. Kristensen and Robert S. Norris “Global nuclear weapons inventories, 1945-2013,” Bulletin of Atomic Scientists 69, No. 5 (2013): 75-81, #abstract and various issues of Kristensen and Norris’s reporting of Indian and Chinese nuclear weapons inventories in the Bulletin of Atomic Scientists since 2015. Data for 2014 from the same authors is not available so, per practice for missing data, the values for 2013 was carried forward to that year.
[21] Nayanima Basu, “Why is defence spending not booming?,” Hindu BusinessLine, February 1, 2018.
No comments:
Post a Comment