Michael Kidd
Is the national security of the United States (US) impacted by a strike in India, a bombing in France, a trade war with Russia, or an earthquake in Mexico? Is there social liability within our supply chains as the result of unscrupulous sub-vendors? In most cases the answer is, “We don’t know.” While commanders can quickly assess whether they have assets located in a specific area and may know if they have a strategic vendor at the location, there is little visibility into the location or identification of companies that provide significant products or services to the Department of Defense (DoD).
This article utilizes a case study approach, leveraging social network mapping software to present a cost-effective approach of visualizing the complexity of DoD supply chains, and identifying structural and geographic supply network risks.
Supply Network Landscape
A powerful industrial base and diversified supply chains were a strategic advantage for the US for the past century. The ability to ramp-up production permitted the US to dominate in World War II and to maintain pressure on the Soviet Union (USSR) throughout the cold war, leading to the eventual collapse of the USSR and Warsaw Pact. While complex and diversified supply networks provide high levels of flexibility and redundancy, they also have the potential to obscure strategic nodes. This comes from the concept of supply chains versus supply networks. Diverse vendor bases are conceptualized as independent pyramids but further down the chain, sub-vendors may support multiple primary vendors, increasing the sub-vendor’s potential impact on the system. The use of multiple first tier vendors provides an illusion of diversification. We find however, that there are convergences of 2nd, 3rd, or Nth tier vendors that may diminish the positive impacts of a diverse supply network. It is important for end customers, private or government, to determine how far into a supply chain they should monitor to have the ability to mitigate risk. These decisions will be impacted by resources and risk tolerance. Looking at the two primary companies in this study, an exponential growth of y=0.1237e1.8546x in the number of vendors is observed as tiers are added (figure 1). At some depth, the network becomes so large and interconnected that it reaches a singularity – the Global Economy.
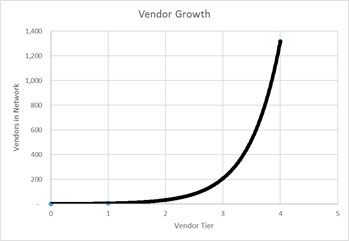
Figure 1: Vendor Growth by Tier
In an increasingly data driven environment, data gathering, storage and analysis comes at a significant cost. With few exceptions, Federal agencies rarely have sufficient resources to analyze data themselves, or demand data from primary vendors, with even fewer requirements for 2nd+ tier vendors. (Title 48 - Federal Acquisition Regulation, 2005) Other than demanding vendors follow proper regulations, federal entities are not conducting effective breadth or depth of supply chain surveillance – effectively sub-contracting this responsibility to industry while maintaining responsibility for failures, without any mechanism to verify it is being done. While this is initially cost effective, it does not insulate the government from negative supply network risks such as material interruptions, sub-vendor malfeasance, or costs and schedule overruns. Furthermore, corporate responsibility, environmental stewardship, human rights, and labor issues add to the basic readiness risks inherent in traditional supply network assessments. Recent US enforcement of sanctions against companies employing North Korean labor demonstrates how important sub-vendor transparency is throughout the supply chain. (U. S. Department of the Treasury, 2018)
Prior Research
There is rich management literature looking at the challenges of studying supply chain complexity. On Social Network Analysis In A Supply Chain Context identifies the added complexity of a social network approach and the need to ensure the relationships to be included are well thought out. They address the strength or importance of various relations, not as reasons to include or not include, but rather to caution researchers to be aware of what they were looking at. Furthermore, they address the significant challenges inherent in gathering supply chain data from firms who consider such information proprietary business information. (Borgatti, 2009)
Chakraborty’s work assessed the perceptions of supply chain managers regarding network complexity as it relates to risk and interdependence among vendor relationships. It attempts to quantify, through Likert-scaled survey instruments the levels of perceived connection between the complexity of systems, interdependency as a result of complexity, and the requisite risk assessments that such complexity drives. (Chakraborty, 2016) While interesting to understand perceived connections, the Likert-scale does not provide actionable benchmarks of complexity or offer guidance for when additional strategies are required based on a defined level of interdependence.
There are various mathematical approaches to defining and optimizing supply networks. Two interesting ones provide insights that may benefit data-oriented planners at a conceptual level without being technically incomprehensible. Both models clearly show that highly optimized supply networks can easily suffer from fragility. Cost reduction often supplants resiliency. Without prior planning, sustainability takes a back seat to reconstituting a broken supply network during a crisis. Mari, et.al. present a model-based approach to optimizing networks while considering disruption risks. As models are developed, their research shows how sustainability metrics such as carbon emissions can be added to a system, as well as how other metrics can be assessed and complexities introduced into the assessment. (Mari, 2014) Similar work by Pedram, et. al. on designing corporate social responsibility into supply chain design provides planners mathematical approaches to optimizing supply networks utilizing non-traditional outcome metrics. (Pedram, 2017) Using cost and resiliency in an optimization model can prove essential to federal supply chain managers who must include numerous factors into their network designs.
This article draws on work primarily grounded in social network theory. Though social networks have been mapped from the earliest recorded records of royal bloodlines and marriages, expanding into in-depth genealogies, the field has blossomed with the rise of social media and the explosion of available data. The network relations of supply chain functions are examined in Qiao and Ryan’s work. Looking at inter-related functional nodes within a supply network, they apply PageRank calculations and clustering metrics to functions within the Plan, Source, Produce, Warehouse, Deliver, Order, and Return areas to assess importance and interconnectedness within the network. By determining how areas interact with one another, planners are better able to determine downstream impacts of disruptions in any area. (Qiao, 2017)
Assessment
For the purpose of this study, two of the Defense Logistics Agency’s primary vendors (3M Corp (MMM), and Rockwell Collins (COL)) are examined. Based on an assessment of these first-tier vendors, a total of 1253 sub-vendors were identified at the 2nd, 3rd, and 4th tiers. At the lower tiers, large conglomerates such as General Electric (GE) were not mapped downstream as they had exceptionally large supplier bases that would have diluted the assessment. Furthermore, supplier data was not available for most companies incorporated outside of the US. These two constraints imply more sub-vendors that were not analyzed.
It is important to understand the challenges facing efforts to understand complex supplier relationships. Foremost is access to information; supply chain data is considered proprietary by most entities. There are significant competitive advantages within supply chains and there are no requirements to include this information in regular SEC filings. There are companies, such as Bloomberg, who mine various sources of business intelligence to develop supply chain transparency and provide this through subscription services. To gain insight without the cost, we used an academic access to the Mergent Online database. This approach looks to identify suppliers of a company from open source data. It does not allow one to track the exact supply chain of a specific end-item, but it does provide insight into the business relationships between vendor and sub-vendors.
Nearly as challenging as accessing baseline information is ensuring that information is up to date. With thousands of sub-vendors, significant resources are required to maintain current records. Relationships change over time creating information obsolescence. Even the use of commercial data services cannot eliminate data latency issues. Since supply networks are in flux, it is likely that existing records may not reflect up-to-date structures. For the purpose of this analysis, a real time look is not required. The methods of identifying supply network risks will not change based on a general level of latency. This will matter more in real-time implementation of this method to identify real time supply network impacts of downstream disruptions.
The 1st through 4th tier vendors are identified through public records captured in the Mergent database, though similar information could be culled through a Bloomberg Terminal, or any number of other data providers. Directional supplier relationships are recorded and entered into NodeXL, a social network mapping application. Similar results can be obtained using any number of products. Using the embedded Harel-Koren Fast Multiscale clustering algorithm, the relationships are clustered based on naturally occurring densities among the supplier-supplied relations. Network density statistics are recorded as each consecutive tier is added to the network. For this study, risk was defined as either:
Network based; when a company supports a large number of other vendors within the network, and whose demise may have impact across the network, or
Geographically based; being from an unstable region or a nation whose relations with the US are less than friendly.
Far from being independent pyramids of vendors – a construct that provides an illusion of diversity within the supply chain, these 1,200 companies share relationships at multiple levels within the network and across tiers. The network can better be conceptuallized as vendor matricies where the direct vendors of one primary company also supply companies up and down the supply chains of other primary companies, in various tiers. In this type of assessment, it becomes clear that many sub-vendors have multiple relationships within the network. This elevates their importance substantially; and problems with that company (either benign or malicious) may quickly spread virally throughout the network. Though simple in concept, the volume of companies connected to the DoD quickly expand the model from a simple combination of relationships as indicated between the total of 8 companies in two supply chains as depected in figure 2, to the highly networked depiction of relationship between companies in figure 3 where differentiation between supply chains is impossible to discern.
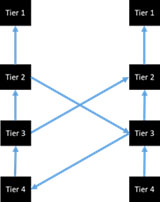
Figure 2: Supplier Matrix Concept
Figure 3 shows significant interactions between the vendor clusters and demonstrates the significant complexity of the network of two primary vendors at the 4th tier of sub-vendors. The interaction between companies in the network is so pervasive that it is difficult to differentiate between MMM’s and COL’s supply network. Networked companies start to have more significant impacts on the overall system due to multiple relationships. For instance, NetApp Inc. supplies Teredata Corp, Datalink Corp, and Avnet within MMM’s supply network. Problems within NetApp Inc could impact MMM more significantly than for example Huntsman Corp, which falls within the same tier but does not provide the same breadth of support.
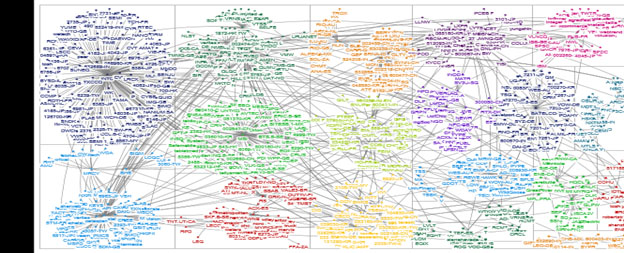
Figure 3: MMM & ROC Supply Network Through 4th Tier
An examination of the mathematical change in network density shows a more disbursed (less dense) network as additional tiers are added. The rate of change however slows significantly as vendors are added to the model. The assessment in Table 1 shows a relationship of y=1.0664x-0.88 between the number of vendors and the network density. This indicates that there are diminishing improvements in supply network diversity as additional tiers are examined. Though beyond the scope of this study, there is academic value in empirically mapping the point at which density trends reverse despite additional tiers.
between the number of vendors and the network density. This indicates that there are diminishing improvements in supply network diversity as additional tiers are examined. Though beyond the scope of this study, there is academic value in empirically mapping the point at which density trends reverse despite additional tiers.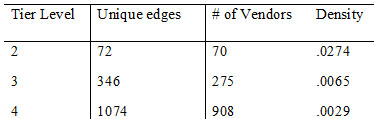
Table 1: Network Statistics per Tier
Looking first at the network-based risk, a PageRank approach to identifying key sub vendors is implemented where the number of connections an individual vendor has with other vendors in the system is calculated. Utilizing this approach, the top 6 suppliers that support multiple vendors within the DLA supply chain, as examined through MMM and COL are:
Tech Target Inc – Supports 12
Amazon.com – Supports 8
Intest Corporation – Supports 8
Jive Software – Supports 8
FLEX Ltd – Supports 7
Pericom Semiconductor Corp – Supports 7
Additional investigations within the DLA vendor universe would likely identify more sub vendors that are supporting multiple suppliers across the network.
Transferring from the network perspective to a geographical approach - a review of where sub-vendors are located shows the following countries with greater than 10 vendors downstream of the two suppliers examined. Of interest is seeing if these countries are spread among different portions of the supply network. If they are clustered together it presents a systemic risk in the event of regional disruptions and presents additional vectors for supply chain insertion attacks. While a disbursed approach presents less risk to supply chain disruption due to the ability of other geographies to fill support requirements, a tighter group simplifies the focus of surveillance.
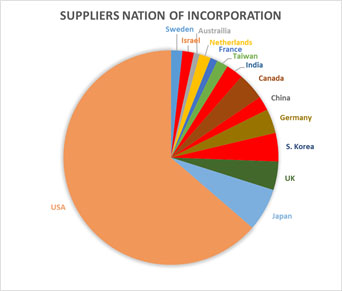
Figure 4: ROC/MMM Supply Network Origin Occurences
During steady state operations, it is important to visualize where sub-vendors are located and how political or regional disruption could impact the supply network. Figures 5 and 6 show sub-vendors and the companies they support, shown in red, across the entire supply network for Russia and China, and for South Korea and Japan. These geographic areas are chosen to show the ability to delve into nations or regions where disruptions are easily anticipated based on geopolitical frictions, but the method may be applied to any region of interest.
The Russia/China depiction (Figure 5) shows that among the two vendors examined, there is no significant concentration of sub-vendors from those nations in any one of the sub-vendor clusters. While it would require significantly higher levels of surveillance to assess the potential impact of losing access to these vendors, it is unlikely they would be able to cripple the supply network. While the supply chain network risk associated with the vendors identified in this assessment appears to be minimal, there are intelligence concerns relating to supply chain insertion of malware and DoD entities have been directed to avoid products that may be vulnerable. (Stone, 2018)
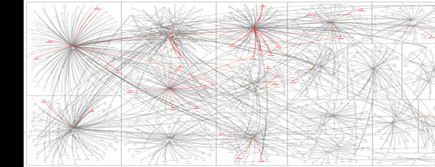
Figure 5: ROC/MMM Supply Network w/ Vendor Relationships w/ Russia & China (Highlighted)
Conversely, the South Korea / Japan depiction (Figure 6) indicates a higher level of impact should regional conflict or natural disaster lessen our ability to receive support from regional sub-vendors. There is a higher density of these vendors within and across more of the supplier clusters. This information is important not only to commanders who need to realize what the impacts of regional suppler disruptions may have on their support, but also planners who address regional disruptions as they pertain to providing support to an affected area.
Applicability
The vendor maps are a top down perspective on the previously opaque supply networks of our primary vendors. The relationship maps and vendor roll-ups can highlight nodes where network, political, or geographic locations increase the level of risk associated with a specific sub-vendor. This perspective provides a tool for the allocation of resources to surveil vendors or establish mitigation plans. It allows decision makers to see multiple nodes across a large network and assess their risk level from a broader perspective.
With regards to the initial questions of “do we care about…?” this tool takes us from “we don’t know” to “we may”. In order to determine what impact global events have on our national security, this tool should be applied from the bottom up. For example, consider the effects of an earthquake in Mexico. Using the preceding four tier sub-vendor map, we determine both primary vendors have downstream liabilities to disruptions in Mexico: MMM has six Mexican vendors at the third and fourth tier. Three support their second-tier vendor, Wabash National Corp, two support their second-tier vendor, Terra Data, and one supports their second-tier vendor, Electronics For Imaging Inc. COL is less susceptible to Mexican disruptions, but they also have a fourth-tier vendor who supports their second tier, Iridium Communications Inc. This is an example with a relatively small sample size, but the same process can be applied to larger sets of vendors to identify downstream impacts of disruptions elsewhere in the supply network. With this visibility, the US government can work with primary vendors to assess potential impacts, and if necessary, start working contingency sources of supply, thus mitigating any impacts to the DoD enterprise.
Recommendations
Globalization is a reality and increasingly complex supply networks must be anticipated. The concern is how quickly the supply chain transfers overseas, often time to nations whose relationships with the US are not stable. These blocks of sub-vendors propose significant amounts of risk when they include large numbers of specific tiers. This leaves few options should trade with those countries be curtailed because of political, environmental, or business disruptions. From a security perspective, it is imperative that intelligence resources are made aware of potential vectors within the nation’s suppler networks and assess whether to task resources to the issue. Conversely, logistics entities must be consumers of intelligence, increasing the likelihood that disruptions are identified early, allowing development of alternate sources with a different regional risk profile.
While systemic complexity is not a concern at the rates observed – the identification of sub-vendors with impacts across the network should be examined. Surveillance assets should be directed to those companies so that any significant disruptions of those key companies can be shared with prime vendors to allow them to intervene. It also provides DoD the ability to plan for short term disruptions before they begin impacting readiness.
In a dynamic global environment, monitoring and surveillance of supply networks requires substantial focus and resources. It is similar to the market research currently mandated within contract development and management. While DoD may have some capability to execute the tasking, there are numerous challenges that should be considered before deciding on internal vice contracted monitoring. Until there is perceived value to the research and a sufficient cadre of experienced individuals, there is a likelihood of failure if managed completely within DoD. (Skubic, 2001) Employment of commercial services and partnering with research universities are likely to provide improved visibility in the most expeditious manner. This approach would leverage existing DoD expertise with a more developed civilian supply surveillance infrastructure.
An enterprise assessment of potential supply chain risks, to include likelihood of occurrence and severity, should be combined with a PageRank factor of impact across the network to develop an overall supply chain risk-impact factor calculation for all networked vendors. This will be an incomplete calculation without economic impact numbers that may not be available; however, even an incomplete assessment is a value-added improvement.
This approach, however, is not the definitive approach to supply network risk management. Without resource constraints, each network node could be independently assessed and optimized for a range of criteria. This model is a base level that allows managers to overlay traditional risk models to direct resources where they have the highest impact. (Figure 6)
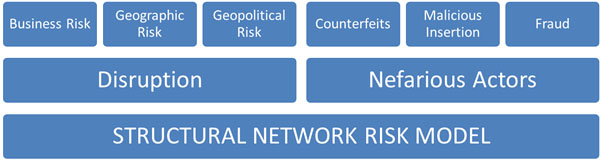
Figure 6: Nesting of Risk Models
Further Research
It would be useful to better understand the quantification of economic relationships between vendor/sub-vendor relationships to provide insight into the level of interdependence. Additional visibility into relationships central to specific supply chains of interest will provide leaders with better insight into the risk inherent in the supply network. The difficulty in collecting this data may make this assessment prohibitive on a large scale, but focusing on the most critical nodes will provide the highest benefit.
The views presented in this paper are the authors’ and not necessarily those of the Department of Defense, the U.S. Navy or the Defense Logistics Agency.
No comments:
Post a Comment