by UPFINA

The weak Chinese economic data sent US stocks careening lower last week as investor pessimism increased even though estimates for Q4 GDP growth increased. The Atlanta Fed GDP Nowcast changed from expecting 2.4% growth to 3% growth. This tracking estimate gets more accurate as the preliminary GDP estimate comes closer to being released. The issues with China shouldn't be surprising, but they still affected markets.
China's growth has been slowing for years, with only a slight uptick in 2017. There were some solid economic reports earlier this year because firms increased their business before tariffs were implemented. In that case, the tariffs actually boosted growth temporarily.
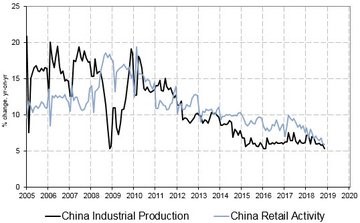
Now that the increased demand is over, China's economy is once again enduring the wrath of their economic slowdown combined with the added anchor of US tariffs to deal with. As you can see from the chart below, both industrial production and retail activity growth has been slowing in the past few years.
Source: Twitter @takis2910
November industrial output was up 5.4% year over year which missed estimates and October's growth rate of 5.9%. This is the slowest growth since January to February 2016. Growth started the year at its year to date high point which was 7.2%.
Retail sales growth was 8.1%, which would be amazing for America, but is poor for China which is a developing economy. Retail sales growth was expected to be 8.8% which would have been an increase over the 8.6% growth in October. Growth fell sharply instead of increasing modestly. Economists were wrong on that prediction. They didn't consider the temporary increase caused by the tariffs. At this pace of deceleration, Chinese economic growth will soon be in the range America has grown at this cycle. Goldman Sachs expects Chinese GDP growth in 2019 to slow from 6.6% to 6.2% even though China is cutting taxes as a stimulus measure. The only modest positive from this group of metrics is fixed asset investment for the first 11 months of the year was up 5.9%, instead of 5.8%. It accelerated from the 5.7% growth in the first 10 months of 2018.
Obviously, these reports weren't well received by markets. The Shanghai Composite index fell 1.53%. It is up 4.32% from its October 18th low, but is still down 22.54% year to date. China has been hurt by the trade war and most emerging markets have been struggling because of the Fed rate hikes. However, there seems to be another long term trend which is pushing growth lower.
Back In The USSR?
The bedrock of the Chinese economy being driven by the government prevents innovation and efficient use of capital which can generate meaningful returns. Private firms only generate 52% of industrial output. Lately, China's economy is going backwards as the share of government enterprises is growing. China started its growth trend a few decades ago by liberalizing the economy. Now, China needs further liberalization to regain the growth rate it achieved earlier in the 21st century.
The chart below compares China with the USSR.
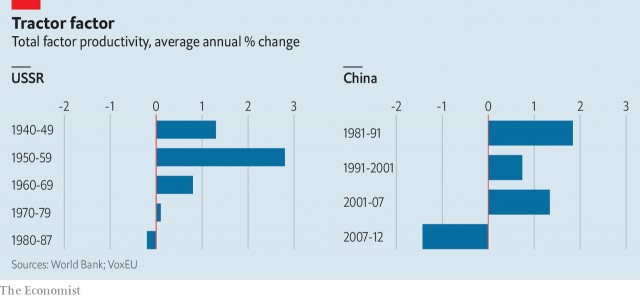
Source: The Economist
Both the USSR and China had productivity growth from the start, presumably because of a lack of previous investment, or in the case of the USSR, a war torn country following WWII. Later in the chart, the hard part kicks in which explains the negative productivity growth. China's growth from 2007 to 2012 was worse than in the USSR before it collapsed. Additionally, as a result in part to the one-child policy, China doesn't have great demographics. It has been relying on bringing its poor into the middle class to expand, however, in rate of change terms this becomes much harder to continue without further liberalization of its markets.
Bad news could be good news because the more China's economy weakens, the more pressure is placed on its government to make a trade deal with the US. A trade deal could improve the weak outlook for 2019, but it won't turn the long term slowing trend around unless the Chinese government reduces its impact on markets.
Weak Leading Indicator
The Cass Freight index supports the recent decline in stocks and the weak ECRI leading index which was down 3.9% year over year as of the December 7threading. As you can see from the top chart below, the Cass Freight index is barely growing which suggests the growth in goods being shipped is diminishing.
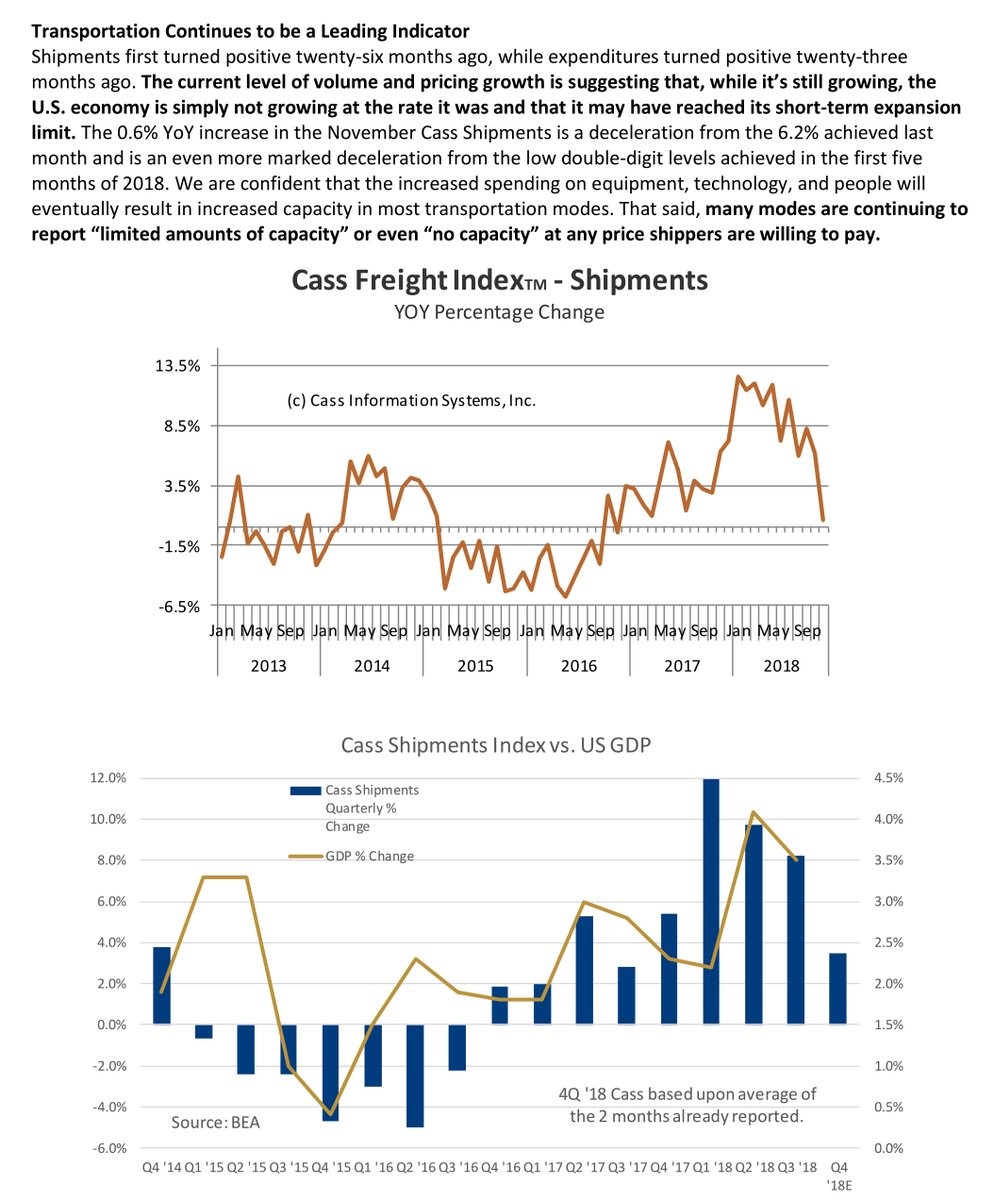
Source: BEA
Dow theory suggests that when the transports are weak, the economy is weak. The transport stocks have been declining in the past few weeks. From September 10th, the XTN ETF is down 19.89%. The only good news is the Cass Freight index's growth is still above the 2015-2016 slowdown. As you can see from the bottom chart above, it implies GDP growth will be about 2.4% in Q4.
Weak Housing Market
Besides the transports, the other notable underperformer has been the regional banks. They don't like slowing economic growth, falling interest rates, a flattening yield curve, and a weakening housing market. The KBW regional bank index is down 26.22% since its recent high on June 8th.
A unique measurement of the housing market calculated by Redfin is shown below.
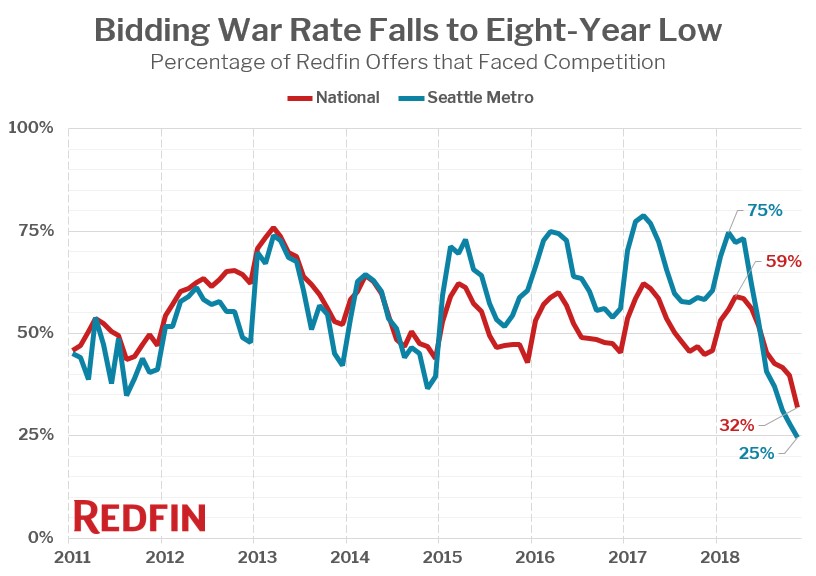
Source: Redfin
This chart measures the percentage of houses sold with multiple offers. Seattle has been underperforming which isn't a surprise because the momentum in that city has subsided this year. It's amazing to see the national rate has fallen to 32% which is the lowest since 2011 when Redfin started tracking this data. Even cities like Raleigh and Miami saw drops as they decreased from 31.4% and 40% in November 2017 to 19.4% and 20% in November 2018, respectively.
The charts below are cross sections of important housing data.
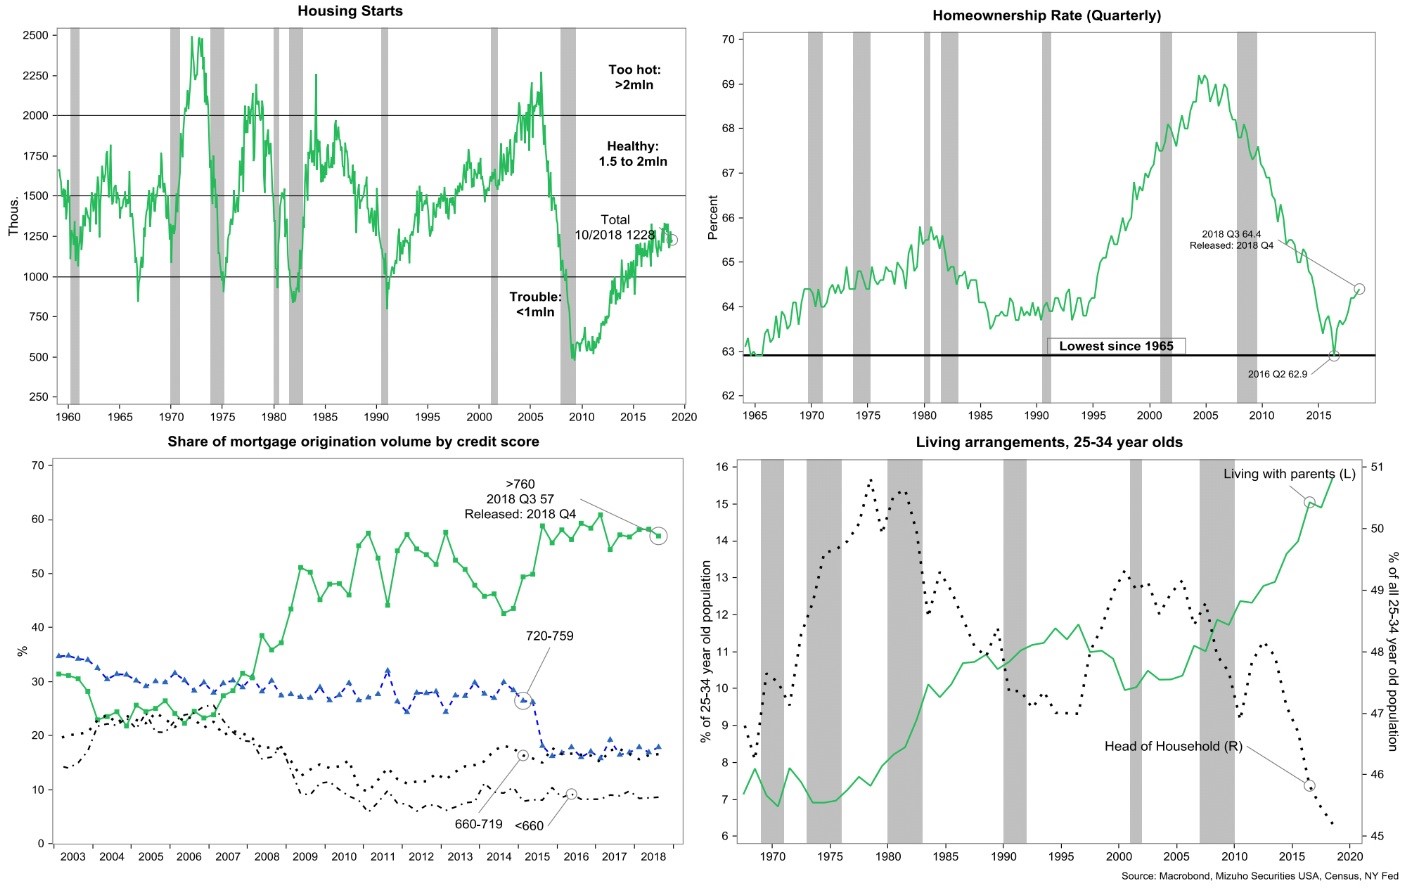
Source: Mizuho Financial Group
Housing starts haven't recovered this cycle. The homeownership rate has finally started to normalize. Private mortgages are mainly being originated by people with great credit scores. The chart on the bottom right is devastating as the percentage of 25-34 year olds living with their parents has increased from about 7% in 1970 to about 16% now. It has even increased 3% during this expansion because of high student loans. The percentage of 25-34 year olds who are heads of households has fallen from over 50% in 1980 to about 45% now.
Conclusion
Chinese economic growth is slowing. The good aspect of this is this deceleration might encourage China to make a trade deal with America and liberalize its economy. The Cass Freight shipments index suggests stocks are correct to decline. However, the slowdown isn't as bad as 2015-2016 yet. The housing market is weakening as there are fewer bidding wars. The long term trend of more young adults living with their parents is devastating.
No comments:
Post a Comment